
...find genes/diseases identifiers?Select the identifiers to execute a query in PhenUMA. Severals resources are available to find the gene or disease of interest: NCBI , Ensembl, OMIM , HGNC and Orphanet. |
..manage the interface?The visualizer allow to interact with the network. Some controls are located in the left-hand panel: filters, check phenotypic information of the selected nodes, enrichment analyses... |
...download the output data?Resulting networks can be downloaded in text file format. This makes it possible to work with the results using other platforms as Cytoscape. |
...visualize resulting networks using Cytoscape?Text files returned by PhenUMA can be used in Cytoscape. This video tutorial shows how to visualize PhenUMA networks using this tool. |
1 Select "Network" option |

|
2 Select the input type: genes, OMIM diseases, Orphan diseases or Phenotypes |

|
3 Write your queryIntroduce a list of genes, diseases or phenotype separate by commas: 
|
4 Select the output networkSelect the network that you want to visualize. |

|
5 Choice the confidence levelThree leves of confidence are availiable. Select a high to get a network with the more significative relationships. If you want to lower the threshold select a medium or low confidence. |

|
6 Press "Execute" button and wait some seconds while the query is performed.Once the network has been generated the table/visualizer view will be shown. |

|
1 Select "Enrichment Analysis" option |

|
2 Select the input type: genes, OMIM diseases, Orphan diseases |

|
3 Write your queryIntroduce a list of genes, diseases separated by commas: 
|
4 Select type of analysisSelect the network that you want to execute. |

|
|
The avaliable enrichment analyses are:
Notice that is possible execute a functional enrichment from a list of diseases. In these cases, the set of genes related to each input disease is used to perform the analysis. |
5 Press "Execute" button and wait some seconds while the query is performed.Once the network has been generated the enrichment table will be shown. |

|
GenesEntrezGene/GeneID is the indentifier recommend for queries of genes in PhenUMA. However, others identifiers are supported: Gene Symbol speciffically the official symbol provided by HGNC, Ensembl, HGNC id, MIM and Orpahnum. Visit http://www.ncbi.nlm.nih.gov/ , www.genenames.org , http://www.ensembl.org/index.html or http://www.orpha.net/ to find the identifiers of your genes. Gene Symbols Important! If you choose HGNC, MIM or Orphanum identifiers you must indicate the database of reference (i.e MIM:123610, HGNC:2394 or ORPHA:120836) to avoid confusion. Different identifiers: |
OMIM Genes/DiseasesFor queries of OMIM genes or diseases a list of MIM id must be provided: Visit www.omim.org to find the identifier of your disease(s) of interest. |
Orphanet DiseasesUse orphanum identifier: Visit www.orpha.net to find the identifier of your orphan disease(s) of interest. |
PhenotypesUse HPO id identifier: Visit http://compbio.charite.de/phenexplorer/ to find the identifier of your phenotype of interest. |
|
Read more about identifers in |
Network building with PhenUMA requires of the selection of a type of network. These networks can be classified in Gene-Gene, OMIM-OMIM, ORPHA-ORPHA and Phenotype Query Network. Additionally, bipartite networks are available too. The type of networks available depends on the input type selected.
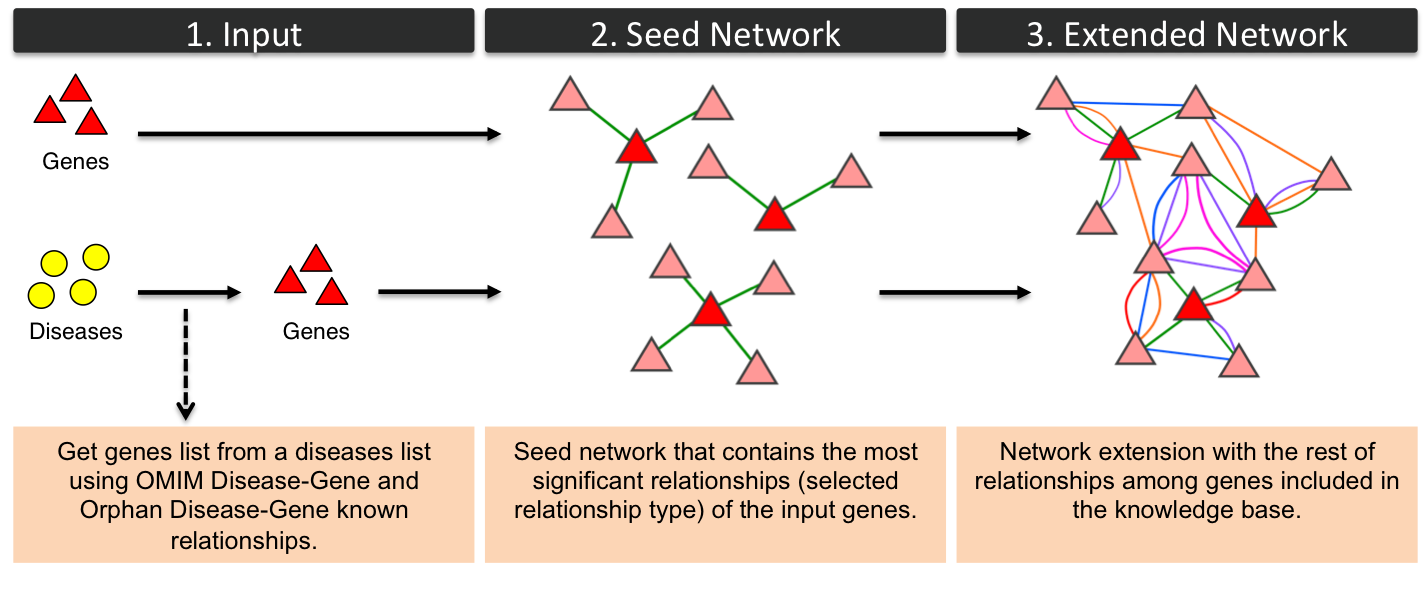
Gene-GeneGenes networks can be built from a list of genes or diseases (OMIM diseases or Orphan diseaes). If a list of diseases (yellow circles) is provided the relationships between genes and diseases, obtained from OMIM and Orphanet, are used to create a list of input genes (red triangles). Seed network includes relationships between the input genes and the rest of genes of the knowledge base. The type of relationship of seed network is the selected by the user: Gene-Gene Semantic Similarity from HPO, Gene-Gene Semantic Similarity from GO, etc. Finally, the network is extended with the rest of relationships among genes included in PhenUMA: phenotypic (HPO), functional (GO), protein-protein interactions (STRING), metabolic (Veeramani et al.) and inferred relationships. 
|
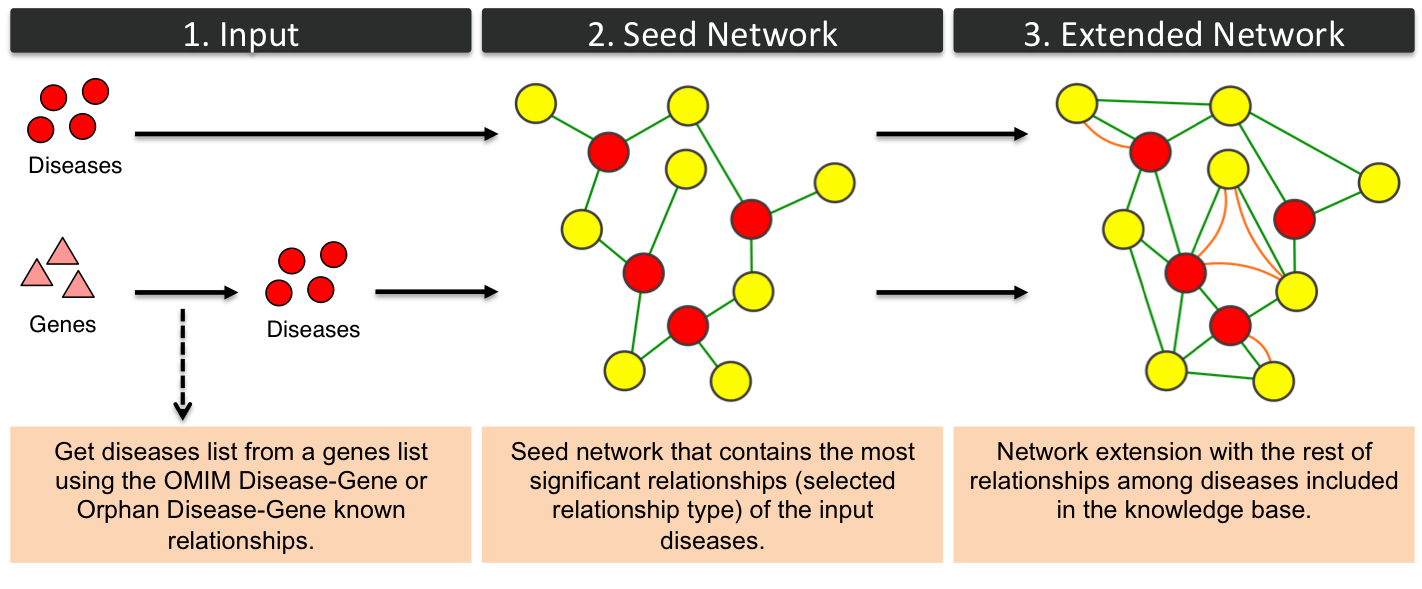
OMIM Disease - OMIM Disease / Orphan Disease - Orphan DiseaseThe procedure used to generate diseases networks is similar to genes network workflow. The following figure represents OMIM diseases (yellow circles in PhenUMA) networks but could be extrapolated to Orphan diseases (blue octogons in PhenUMA) networks. Extended network includes phenotypic and inferred relationships among diseases. 
|
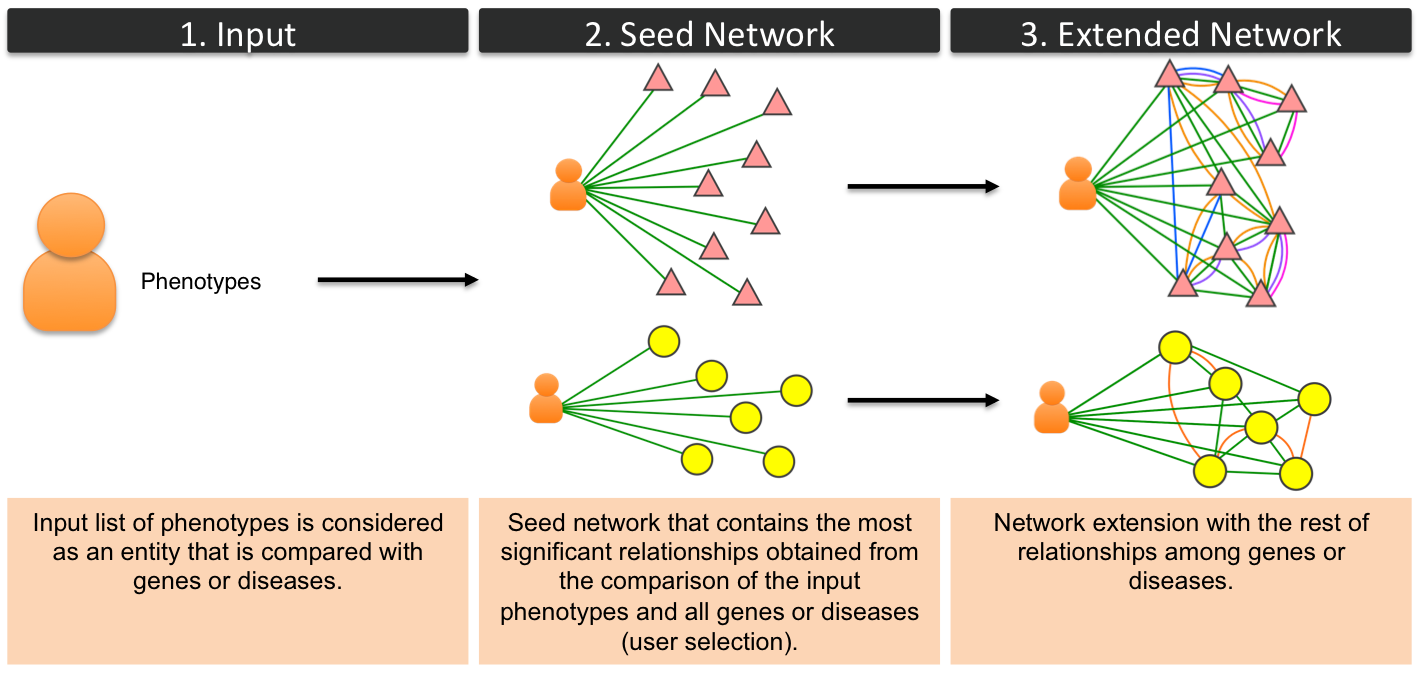
Phenotypic Query NetworkIn this type of networks the input list of phenotypes is considered a phenotypic profile and is compared with the rest of genes or diseaes (OMIM or Orphanet). The rest of the steps are similar to the rest of networks. 
|
We are working to provide a complete tutorial in HTML and more help resources, however provisionally, you can download this preliminary version in PDF format from the following link:
| |
Download Tutorial PDF |
Phenuma Course 2013 organized by Ciberer and given the 13 and 14 of June of 2013: